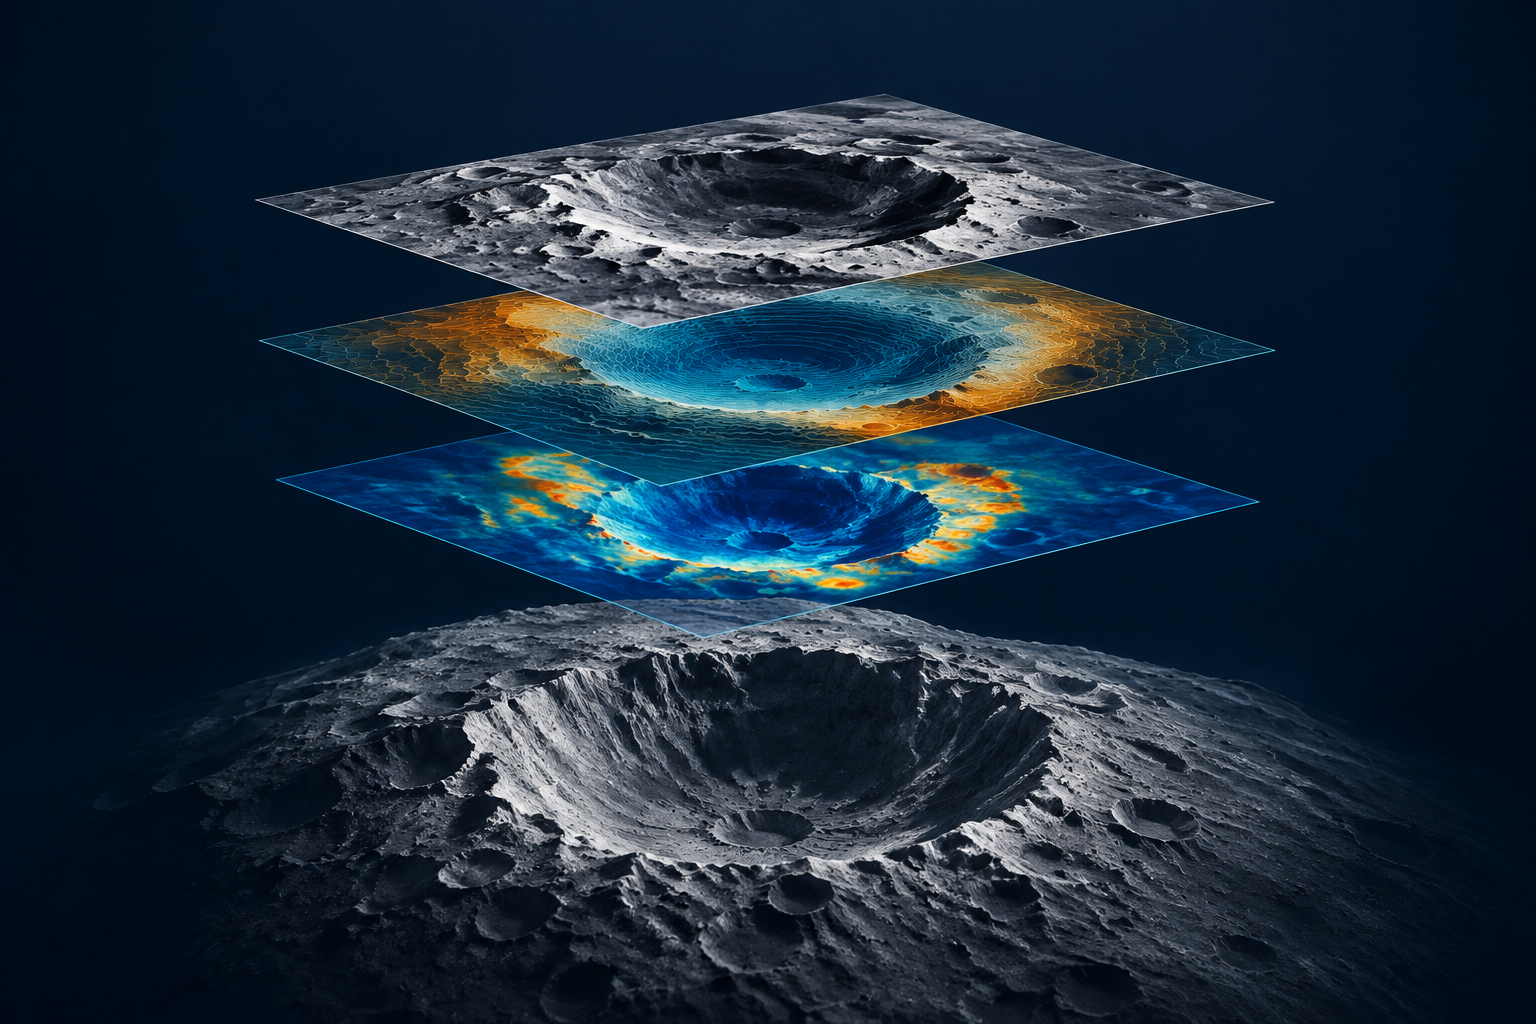
The NASA-IBM Lunar Foundation Model is an open AI model for analyzing lunar observations. Announced on September 10, 2026, it can be adapted to detect craters, outline volcanic features, and predict patterns in an ice-prospectivity map. Its reported gains concern specific research benchmarks: the headline ice result is lower prediction error, not the discovery of 22% more water on the Moon.
For students and researchers, the useful starting points are the بطاقة النموذج الرسمية, the technical report, and the released code. Together they explain what the model learned, which tasks were evaluated, and what you would need to build your own experiment.
If your first job is understanding the research, جلوبال جي بي تي تي brings source discovery, document analysis, reasoning, and writing into one multi-model workspace. It offers an affordable way to move from unfamiliar scientific terms to a clear research brief through a single subscription.

What is the NASA-IBM Lunar Foundation Model?
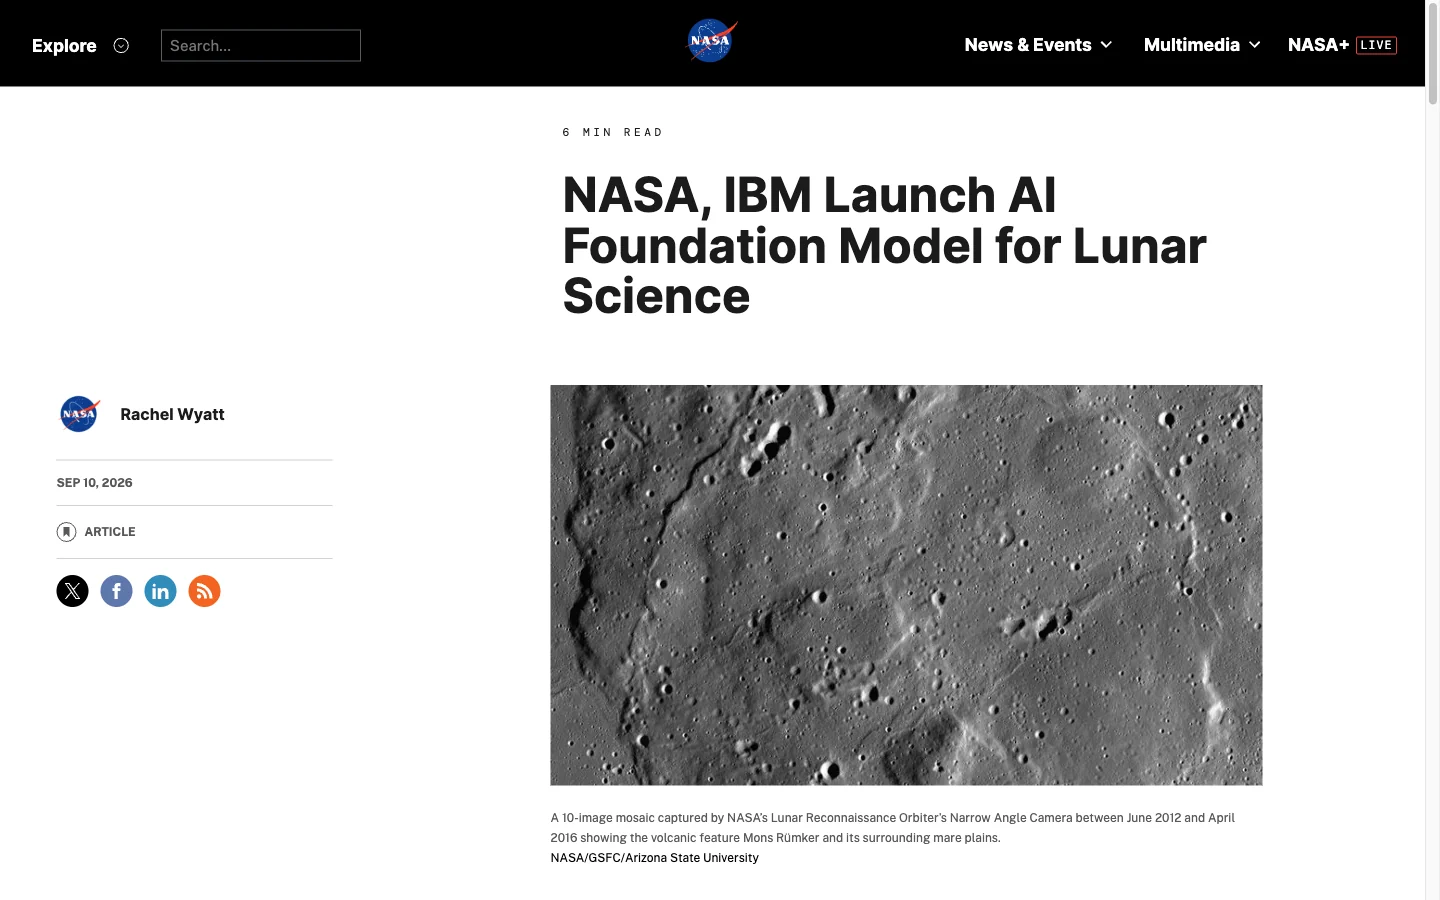
NASA’s announcement introduces the project as a foundation model for lunar science, developed with IBM. A foundation model learns reusable patterns from a broad collection of data; researchers then adapt those patterns to a narrower task. Here, the material is lunar remote-sensing data rather than everyday language.
The NASA-IBM LFM uses a vision-transformer encoder and decoder, with a ViT-B architecture. Its inputs include imagery and other observation products at different spatial resolutions. A scientist can adapt the resulting representation for detection, segmentation, or regression—three ways of finding objects, outlining regions, and predicting numerical values.
That makes the release useful to teams working with lunar maps and to students studying planetary machine learning. Reading the project is also worthwhile for anyone trying to understand how a scientific AI model is evaluated. Using its checkpoint, however, is a research-computing workflow rather than a chat conversation.
What data does it learn from?
إن model card describes the SomBench training data: 963,609 Wide Angle Camera (WAC) tile bundles and 1,000,113 Narrow Angle Camera (NAC) bundles. The WAC scale is about 100 meters per pixel; the NAC scale is about 1 meter per pixel. This gives the model both broader terrain context and much finer surface detail, across roughly two million bundles.
IBM describes the wider data resource as more than 30 aligned layers from nine instruments across four missions. The model card specifies 11 input modalities. These figures describe different stages of the data pipeline: source layers, packaged training examples, and types of input the model encodes.
One project, three different counting units
IBM describes a data resource assembled from nine instruments across four missions.
963,609 WAC bundles and 1,000,113 NAC bundles provide two scales of training material.
The model encodes different kinds of observations, including imagery and terrain products.
Source layers, tile bundles, and input modalities count different things. Sources: IBM’s dataset description و بطاقة النموذج الرسمية.
Lighting is part of the design, too. The model receives observation geometry, including illumination angles, as explicit context. This helps distinguish how a surface looks under particular lighting from the underlying terrain patterns it is learning.
A pixel representing roughly 100 meters of terrain cannot reveal the same details as a pixel representing roughly 1 meter. That is why the WAC and NAC crater results deserve separate attention. A gain on broad-scale imagery does not establish the same gain on small surface features.
The project follows the TerraMind pretraining approach but trains on lunar data from scratch. It should therefore be understood as a model built for lunar observations, rather than an Earth-observation checkpoint with a new name. The relevant question is how its learned representation helps a particular lunar task.
Three tasks it can support
The published evaluations cover three task families. Each produces a different kind of answer, so the meaning of “better” changes with the task.
| المهمة | الناتج | What the result can support |
|---|---|---|
| Crater detection | Bounding boxes around craters in WAC or NAC imagery | Comparing how well a detector finds and locates labeled craters. |
| Irregular Mare Patch segmentation | A pixel-level outline of volcanic surface features | Studying how closely predicted regions match labeled feature boundaries. |
| Polar ice-prospectivity regression | A continuous prediction of a knowledge-driven prospectivity map | Studying agreement with a modeled target for possible ice-related conditions. |
Crater detection and volcanic-feature segmentation can help researchers organize and analyze imagery. Their usefulness depends on the labels, scale, and evaluation area. A model that performs well on a defined test set still needs assessment on the data and scientific question of a new project.
Ice prospectivity needs the most careful interpretation. The target is a knowledge-driven map of where ice may be plausible, not a direct measurement of ice deposits. Better agreement with that map can support research into patterns and candidate regions. It does not tell us that an additional quantity of water has been found.
What the benchmark results mean
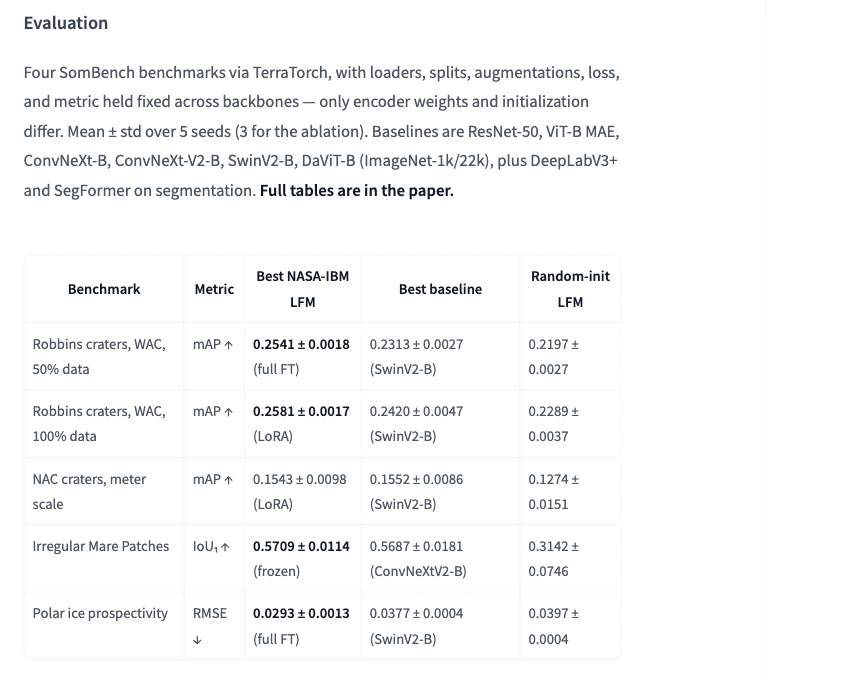
إن technical report provides means and standard deviations across five random seeds. Its results compare adapted lunar-model configurations with named vision-model baselines. We checked the published tables; we did not reproduce the lunar experiments.
The metrics answer different questions. Mean average precision (mAP) evaluates object detections; intersection over union (IoU) measures overlap between predicted and labeled regions; root mean squared error (RMSE) measures numerical prediction error. Higher mAP and IoU are better, while lower RMSE is better. They should not be combined into one accuracy score.
Ice-prospectivity error: the clearest reported gain
RMSE fell from 0.0377 to 0.0293 against SwinV2-B, a 22.3% relative reduction. Lower RMSE means closer agreement with the benchmark’s ice-prospectivity map.
RMSE, lower is better. Bars start at zero. Mean ± standard deviation over five seeds. The target is a modeled prospectivity map, not a measurement of ice.
| Task and data | Metric ↑ | Lunar model | Strong baseline |
|---|---|---|---|
| WAC craters · 50% training data | mAP | 0.2541 ± 0.0018 full fine-tuning | 0.2313 ± 0.0027 SwinV2-B |
| WAC craters · 100% training data | mAP | 0.2581 ± 0.0017 LoRA | 0.2420 ± 0.0047 SwinV2-B |
| NAC craters · 100% training data | mAP | 0.1543 ± 0.0098 LoRA | 0.1552 ± 0.0086 SwinV2-B |
| Irregular Mare Patches | IoU1 | 0.5709 ± 0.0114 frozen encoder | 0.5687 ± 0.0181 ConvNeXtV2-B |
The authors describe meter-scale crater and volcanic-feature results as comparable to strong baselines. Their small differences should be read alongside the run-to-run variation.
المصدر: NASA-IBM technical report, Tables 4–7, pages 16 and 18. These are the authors’ results, not an independent reproduction.
The 22% ice result is a reduction in error
For ice prospectivity, the strongest reported lunar configuration has RMSE of 0.0293, versus 0.0377 for SwinV2-B. The calculation is (0.0377 − 0.0293) ÷ 0.0377 × 100 = 22.3%. RMSE measures prediction error against the target map; lower is better. This percentage is neither an accuracy score nor a change in the amount of lunar ice.
Crater results depend on the metric and data scale
With 50% of the WAC training data, the lunar model records mAP of 0.2541 versus 0.2313 for SwinV2-B. That same lunar-model result also exceeds the baseline’s 0.2420 with 100% of the training data. The first comparison uses equal data fractions; the second is evidence of label efficiency in this particular experiment.
IBM’s roughly 19% crater improvement can be reconciled with the report’s AP@75 values at 50% training data: 0.2213 versus 0.1862, an 18.9% relative increase. AP@75 evaluates detections at a particular overlap threshold. It should not be relabeled as a 19% increase in the table’s mAP metric.
At the finer NAC scale, the lunar model’s mAP is 0.1543 and the baseline’s is 0.1552. For Irregular Mare Patches, the reported foreground IoU values are 0.5709 and 0.5687 against ConvNeXtV2-B. The authors describe these tasks as comparable to strong baselines. Small differences, alongside the reported variation between runs, do not support a claim that the lunar model wins everywhere.
Where to get it and what access costs
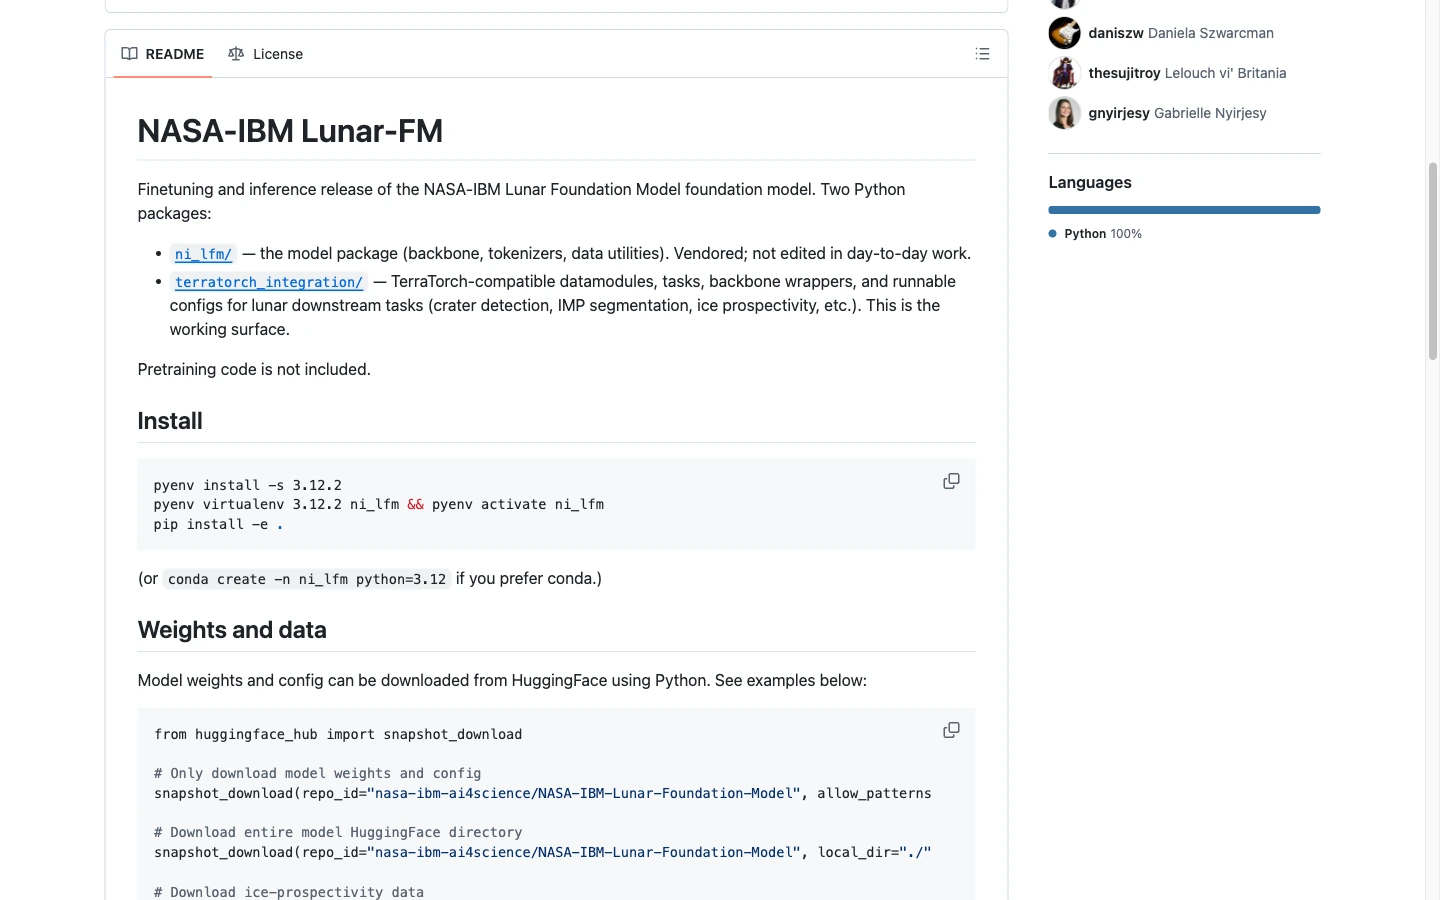
Start from the official resources below. The model weights and code carry an Apache-2.0 license, and the checkpoint is publicly available. The repository specifically describes a fine-tuning and inference release; it explicitly excludes pretraining code.
Choose the resource for your next step
Start with intended uses, input data, licensing, and the limitations.
The Files tab contains the released checkpoint and accompanying files.
Use the README and TerraTorch task configurations to plan an experiment.
Follow the official collection to related downstream models and datasets.
Tables 4–7 provide the task results, settings, and variation across runs.
Explore the project’s demo entry. We did not execute a generation in this review.
The model card listed no deployed Hugging Face Inference Provider when checked on September 28, 2026. A downloadable checkpoint and a demonstration page are separate access routes.
If you want to adapt the model, choose the downstream task before setting up the experiment. The repository supplies TerraTorch-compatible components and configurations that connect the checkpoint, task, and data. TerraTorch is the software framework used to organize that training and evaluation workflow.
- Read the model card and the README, then choose detection, segmentation, or regression based on the scientific question.
- Obtain the corresponding data and official checkpoint, and inspect the repository’s task configuration and environment instructions.
- Prepare the data for that configuration and run the relevant fine-tuning or inference workflow.
- Evaluate against an appropriate baseline and retain the data split, settings, and outputs so the result can be checked.
Open access removes a model-license purchase from the starting process, but running an experiment still has costs. You need compute, storage, data preparation, and time for evaluation. A released checkpoint does not automatically come with a hosted API or free GPU time, and the sources do not establish a universal minimum GPU for every downstream task.
| هدفك | Resource or cost to plan for |
|---|---|
| Read and assess the release | Public announcements, model card, report, and repository. |
| Run or adapt the scientific model | Suitable compute and storage, relevant data, environment setup, and evaluation work. |
| Understand papers and write a research brief | A research assistant workspace such as GlobalGPT, with model access and document tools in one subscription. |
Use AI to understand the research
A productive first question is narrow: “What does the reported 22% improvement actually measure?” Answering it requires a target, a metric, a baseline, and a calculation. Asking for those four items is more useful than asking an assistant whether the model is impressive.
GlobalGPT lets you carry that reading work through source discovery, document explanation, and writing without moving between separate tools for every step. For a repeatable method, build a source-checked research brief with a short source list and explicit questions before requesting a polished summary.
From official sources to a useful briefing
- Collect the primary material. Start with NASA’s announcement, then add the model card, technical report, and README. You can research with Perplexity on GlobalGPT to locate supporting sources.
- Ask focused questions. Have an assistant explain mAP, IoU, and RMSE separately, then list the target, baseline, and evaluation setting behind each claim.
- Check and write. Reopen the cited table, verify each number, and turn the checked notes into a briefing that preserves the scientific limits.
We tested a small version of this workflow with GPT-5.6 Sol. It received a packet distilled from the four official sources and had to produce a short briefing, classify six claims, calculate the RMSE reduction, and suggest practical next steps. The task used supplied text; it did not browse for new evidence.
A source-based briefing test
We gave GPT-5.6 Sol a short packet drawn from NASA’s announcement, the official model card, the technical report, and the GitHub README. It had to write a briefing, check six claims, and explain the RMSE calculation.
- Workspace and date
- GlobalGPT · September 28, 2026
- سياسة التشغيل
- One task; first complete answer; no retries
- المدخلات
- 355-word source packet with four source IDs
- النطاق
- Reading and synthesis; no live search or lunar-model execution
- Response settings
- Output-token limit: 4,096; all other sampling controls left at service defaults
- Usage and cost
- 2,154 total tokens reported; the response did not include a monetary charge
The first answer kept the scientific claims in scope
The answer produced a 112-word briefing, rejected the claim that the model had discovered 22% more real ice, and retained the restrictions on landing-site certification and pretraining-code access. Its three next steps pointed back to the official model card, checkpoint, and TerraTorch resources.
This was one reading task using supplied material. The source packet already stated the key limitations. The result does not establish performance on autonomous research or lunar remote-sensing inference.
View the exact prompt and source packet
SYSTEM
You are a careful research editor writing for a university student. Use only the supplied source packet. Do not browse. Distinguish reported benchmark measurements from real-world scientific measurements. Cite source IDs in square brackets. If a claim is not supported, say so plainly. Do not invent citations, prices, hardware requirements, or experimental results. Provide the requested answer, not hidden reasoning.

USER
Turn the source packet into a practical research note. Return: (1) a plain-English briefing of 100–130 words; (2) a six-row claim-check table using exactly Supported or Not supported, a source ID, and a one-sentence explanation for each supplied claim; (3) the relative RMSE reduction calculated from 0.0377 to 0.0293, rounded to one decimal place, with a formula and one sentence explaining what it does not measure; (4) three practical next steps for a student who wants to inspect or adapt the released model. Keep the whole response under 500 words.

Claims to check:
1. NASA and IBM publicly announced the model on September 10, 2026.
2. The reported ice-prospectivity RMSE fell from 0.0377 for SwinV2-B to 0.0293 for the full-fine-tuned lunar model.
3. The model discovered 22% more real water ice on the Moon.
4. NASA has validated this model for landing-site certification and hazard clearance.
5. The GitHub release includes the pretraining code.
6. An open checkpoint guarantees that GPU compute and hosted inference are free.

Source packet:
[S1] NASA announcement, September 10, 2026.
Title: NASA, IBM Launch AI Foundation Model for Lunar Science.
URL: https://science.nasa.gov/science-research/artificial-intelligence-lunar-foundation-model/
NASA announced a lunar-science foundation model developed with IBM. It is publicly hosted on Hugging Face, with code on GitHub. It can be adapted for crater mapping, volcanic-feature identification and polar ice research.

[S2] Official NASA-IBM model card and technical report, checked September 28, 2026.
Model card URL: https://huggingface.co/nasa-ibm-ai4science/NASA-IBM-Lunar-Foundation-Model
Technical report URL: https://huggingface.co/nasa-ibm-ai4science/NASA-IBM-Lunar-Foundation-Model/blob/main/NI_LFM_Technical_Report.pdf
The report's Table 7 (page 18) gives test-set root mean squared error (RMSE) for ice-prospectivity regression. Lower is better. Mean plus/minus standard deviation over five random seeds: NASA-IBM LFM with full fine-tuning, 0.0293 +/- 0.0013; ImageNet-pretrained SwinV2-B, 0.0377 +/- 0.0004. The target is a knowledge-driven ice-prospectivity map. These are author-reported benchmark results, not an independent replication or a direct measurement of water ice.
Table 4 (page 16), WAC craters with 50% training data: bounding-box mAP is 0.2541 +/- 0.0018 for full-fine-tuned LFM and 0.2313 +/- 0.0027 for SwinV2-B. In the same rows, AP@75 is 0.2213 +/- 0.0028 and 0.1862 +/- 0.0041 respectively. These metrics must not be interchanged.

[S3] Official model card, Intended use / Out of scope / Limitations.
URL: https://huggingface.co/nasa-ibm-ai4science/NASA-IBM-Lunar-Foundation-Model
The intended use is lunar remote sensing through fine-tuning or LoRA adaptation for detection, segmentation and dense regression. The model is not validated for landing-site certification or hazard clearance. Ice-prospectivity outputs regress a knowledge-driven map, not measured ice. Generated fields are qualitative probes, not calibrated scientific predictions. The model does not maintain an absolute geodetic reference frame. It has not been evaluated beyond the Moon. The listed license is Apache-2.0. The page reports no Inference Provider deployment. This packet provides no promise of free GPU compute or free hosted inference, and no hardware minimum or hosted API price.

[S4] Official GitHub README, checked September 28, 2026.
URL: https://github.com/NASA-IMPACT/NASA-IBM-Lunar-Foundation-Model
The repository describes a fine-tuning and inference release. Pretraining code is not included. Weights and configuration can be downloaded from the official Hugging Face model repository. TerraTorch-compatible datamodules, tasks, backbone wrappers and task configurations are provided. Fine-tuning and testing require the relevant data, checkpoint and task configuration. The README lists an Apache 2.0 license.
View the complete first answer
## 1. Briefing

NASA and IBM announced the Lunar Foundation Model on September 10, 2026. The public release provides weights on Hugging Face and fine-tuning and inference code on GitHub, targeting lunar remote-sensing tasks such as crater mapping, volcanic-feature identification and polar-ice research. Its reported ice-prospectivity benchmark improves RMSE over an ImageNet-pretrained SwinV2-B, but the target is a knowledge-driven map, not directly measured lunar ice. The result is author-reported across five random seeds and is not an independent replication. The model is intended for adaptation via full fine-tuning or LoRA, but is not validated for landing-site certification or hazard clearance. Pretraining code is absent, and the release promises neither free GPU compute nor hosted inference. [S1][S2][S3][S4]

## 2. Claim-check table

| Claim | Verdict | Source | Explanation |
|---|---|---|---|
| 1 | Supported | [S1] | NASA’s announcement is dated September 10, 2026, and identifies the model as a NASA–IBM project. |
| 2 | Supported | [S2] | Table 7 reports RMSE values of 0.0377 for SwinV2-B and 0.0293 for the fully fine-tuned lunar model. |
| 3 | Not supported | [S2] | The figures are benchmark errors against a knowledge-driven prospectivity map, not measurements of real lunar water ice. |
| 4 | Not supported | [S3] | The model card explicitly says the model is not validated for landing-site certification or hazard clearance. |
| 5 | Not supported | [S4] | The GitHub repository provides fine-tuning and inference resources but excludes pretraining code. |
| 6 | Not supported | [S3] | The packet promises no free GPU compute or hosted inference, and reports no Inference Provider deployment. |

## 3. Relative RMSE reduction

\[
\frac{0.0377-0.0293}{0.0377}\times 100 = 22.3\%
\]

This is a **22.3% relative reduction in author-reported benchmark RMSE**; it does not measure additional real water ice discovered or independently validated scientific performance. [S2]

## 4. Practical next steps

1. Read the model card’s intended uses, limitations, and Apache-2.0 license before selecting a detection, segmentation, or regression task. [S3]
2. Download the official checkpoint and configuration from Hugging Face, then inspect the GitHub backbone wrappers and task configurations. [S4]
3. Obtain the relevant lunar dataset and use the provided TerraTorch-compatible components to fine-tune and test, documenting that pretraining code is unavailable and benchmark results require independent evaluation. [S2][S4]
The useful outcome was the preservation of the distinctions: benchmark error versus discovered ice, research use versus landing certification, and released adaptation code versus absent pretraining code. Because those limits were already in the source packet, this is evidence of a successful reading-and-synthesis task, not proof that an assistant would independently uncover every caveat.
For a larger project, plan a deeper AI-assisted research session around separate questions about data, methods, evaluation, and limitations. Keep the source table beside the draft and verify every number again after editing. That habit matters more than how fluent the first summary sounds.
Limits that matter in practice
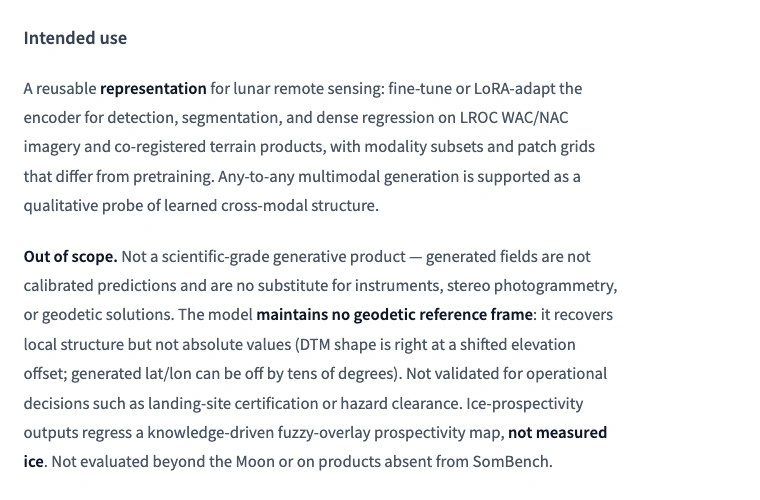
The model card says the lunar model has not been validated for operational decisions such as landing-site certification or hazard clearance. A scientific model may help explore observations without being ready to certify that a spacecraft can safely land somewhere. Those uses require a different level of validation.
Generated fields also need caution. The model does not maintain an absolute geodetic reference frame, and generated values can drift from physical values. The authors describe generation as a qualitative probe rather than calibrated scientific prediction. A plausible-looking terrain or observation map should not be read as a measured product.
The checkpoint has not been evaluated beyond the Moon. Even within lunar research, the benchmark story is mixed: clear gains on some tasks and comparable results on others. The defensible lesson is to judge the model against the target, scale, data, and baseline that match your experiment.
الأسئلة الشائعة
Is the NASA-IBM Lunar Foundation Model free to use?
The official model card and code repository list an Apache-2.0 license, and the checkpoint is publicly available. Running experiments still requires suitable computing resources, data preparation, and task-specific evaluation. Open access to the model does not provide a guarantee of free GPU compute or hosted inference.
Is the NASA-IBM Lunar Foundation Model a chatbot?
It is a foundation model for lunar remote sensing, built to work with imagery, terrain products, and related observation data. Researchers adapt it for detection, segmentation, and regression tasks. A chat assistant can help explain the documentation, but interacting with a chatbot is a different workflow from running this model.
Did the model discover more water ice on the Moon?
The reported ice result measures how closely predictions match a knowledge-driven ice-prospectivity map. The best reported RMSE falls from 0.0377 to 0.0293 against the cited baseline, a relative reduction of about 22%. That is a benchmark improvement; it is not a measurement of additional ice discovered.
Can I explore the project without writing code?
You can read NASA’s announcement, inspect the model card, explore the published benchmark tables, and visit the official demonstration page without building a training pipeline. Adapting the released checkpoint to a scientific task uses the repository’s code, data, and TerraTorch configurations, followed by task-specific validation.
How is the lunar model related to Prithvi and Surya?
They belong to the broader NASA–IBM collaboration on foundation models for science. NASA describes Prithvi models for Earth observations and weather applications, Surya for heliophysics, and the lunar model for Moon observations. Their domains and intended tasks differ; the lunar checkpoint has not been evaluated beyond the Moon.
The NASA-IBM Lunar Foundation Model offers a reusable starting point for lunar remote-sensing research. Use the official tables to understand its strengths, the model card to define its limits, and the released resources to plan a task-specific experiment. If your immediate goal is learning or writing, start by turning those sources into a checked briefing.
Turn a technical paper into a briefing you can use
Bring your official sources to GlobalGPT, work through unfamiliar concepts, and shape the checked findings into clear notes or a finished draft—all in one multi-model workspace.
Explore research with GlobalGPT